Calculated column: week number

I decided to organise a small project by using a SharePoint task list on a Office 365 project site. I figure that if it gets too complicated, I can always just open the entire thing in Microsoft Project.

I realized fairly quickly that seeing week numbers in the list was a valuable thing:

  • Group the tasks by week
  • See the total number of estimated hours per week

I created a calculated column and used the comments on this page, Group A List by Week Number. I ended up changing the formula a little bit – there are some activities in December and some in January, so I wanted to see the year, as well as the week number for sorting purposes.

My final formula:

=YEAR([Start Date])&"-"&If(Int(([Start Date]-Date(Year([Start Date]);1;1)+(TEXT(Weekday(Date(Year([Start Date]);1;1)-1);"d")))/7)=0;52;Int(([Start Date]-Date(Year([Start Date]);1;1)+(TEXT(Weekday(Date(Year([Start Date]);1;1)-1);"d")))/7))

The final result looks like this:

weeknumbers

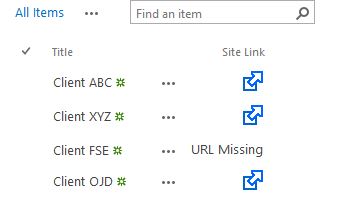
You can see an error on the third line: that’s because [Start Date] is empty on that line, so the week number could not be correctly calculated. I just wanted to get on with the project planning and not spend more time on the formula.

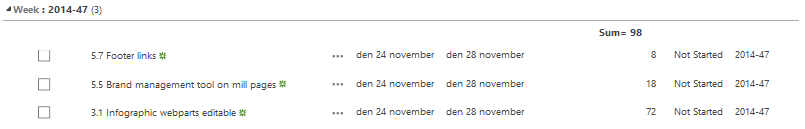
Once you have the week number in place, you can easily make views like this one, where I grouped by Week and then summed up the total hour estimate:

weeknumbers-hours2

The formula has the following considerations:

  • Weeks begin on Monday
  • Working with Swedish regional settings – you may need to change around a few periods, semi-c0lons, etc.

Adding an image + link via calculated column on a list with HTML (Directory List Solution)

I was working on a document management system, where each client had its own site collection and projects were subsites under that site collection. I needed a way to show a list of available site collections from a main landing page.  This needed to show all site collections, no security stripping and search rollup was not an option at this time. The easiest way then is to create a list that acts as a directory – just add the sites to the list manually.

The problem was the link to the sites. How best to do this?

Option 1: Hyperlink site column

Adding a hyperlink site column is easy. You get a clickable result in your field display.

The tricky part is dealing with the fact that a hyperlink column consists of two fields: the web address and then the description.

clientsite1

If you do not fill in a description, the URL is displayed when you view the item.

clientsite2

This approach has a few issues:

  • Showing a text like “Link” is not very nice looking.
  • When an end-user fills in the item, they may not be consistent with the result. You could add a description to the field, but this is still not foolproof.
  • Even though the link is blue, not everyone will realize that you need to click the text to open the site – many people will still try to click the title and then just open the item.  This leads to frustration.

Option 2: Creative use of calculated column

You can use a calculated column to display the link as an image, i.e. an arrow or something that is very obviously a link – how about something like this?

clientsite6

By choosing to use a calculated column, we have ensured that anywhere the column is used, the arrow will be displayed. This means that it will work in any view, any webpart, etc.

*** Update 2017-07-21: This worked on SharePoint 2013 and SharePoint Online until sometime this spring. When using SharePoint Online, it now only works in classic mode – it has been disabled in the new mode.

clientsite4

To replicate, follow these steps. The column names are not important, they are just suggestions.

  1. Upload an image to SharePoint, i.e. in your site assets library
  2. Create a new (site) column of the type “single line of text”, and call it “Site URL
  3. Create a new (site) column of the type “calculated column” and call it “Site Link” or similar
  4. Use the formula as stated below, adjusted for your site and column names –
  5. Change the output of the column from “single line of text” to “number”
  6. Save the column and enjoy

clientsite5

Formula

The formula I used is as follows:

=IF(ISBLANK([Site URL]), "URL Missing", ("<a href="&[Site URL]&" target='_blank' alt='Open site in new window'><img src='/SiteAssets/link.png' style='height:20px; width:20px;' /></a>"))

Broken down, it has a few interesting elements:

  • IF(ISBLANK([column name]), “URL Missing” – if the column with the URL is empty, it will show this text. If you leave off this structure, then the calculated column will simply be empty. You can also change the “URL Missing” text to whatever you would like, i.e. “Please fill in a URL”.
  • A hyperlink is created based on the value of the Site URL column
  • The link opens in a new window (this is specific to my example, as I expect a new window to be more useful for these users)
  • Link to the image
  • Set the image height – I found 15-20 pixels fit nicely into the column. You could also include a class from your CSS.

Tip when editing formulae in calculated columns: use Notepad++, as it will help you see when brackets are closed.  Just make your changes in Notepad++, then copy them into the edit column window each time – this will make it far easier to work with.

clientsite3

Display as HTML

One of the coolest things about this solution is that generally, calculated columns cannot be rendered as HTML. Technically speaking, the contents of the column should just be displayed as plain text. Yet, here we are, with an nice arrow image being displayed and the link working beautifully. The trick is changing the returned datatype from single line of text to number. Once you do that, then the contents are rendered as HTML.

Credit for this solution goes to Danny Engelman at ICC – HTML in a Calculated Column / Field of a SharePoint View.

Site columns and content type hubs

In the real world solution, both the Site URL and Site Link columns were site columns, attached to a content type called Client Directory. The columns were also reused for a similar construction in a Project Directory custom list, which showed the subsites under each client site collection. Using a content type hub, these columns were replicated to each site collection and we were able to build a similar Project Directory in exactly the same way: simply fill in the URL, display Site Link column. This made the solution incredibly flexible and reusable.

Sources

HTML in a Calculated Column / Field of a SharePoint View

Calculated column for priority

I’m currently working on a project where we needed to assign a priority to issues based on impact and urgency. You could always let users figure this out for themselves, but it’s much better to automate it when there are clear definitions for each value and a table which translates the impact and urgency to priority.

priority

My first thought was: “Sure! I’ll do that! It’ll be simple.” Then I found myself looking at the calculated column formula screen and realized that it had been a long time since I had needed this knowledge.

The first limitation is that SharePoint only allows for up to 7 nested IFs. I broke the solution up into four calculated columns:

  1. Priority – Very Urgent
  2. Priority – Urgent
  3. Priority – Not urgent
  4. Priority – calculated

The first three columns calculate the correct priority value based on each urgency line. If the urgency is very urgent, the formula checks to see what the impact is and then sets the field value to the priority listed in the table.  If the urgency in that issue does not match the formula (i.e. if the urgency is not very urgent), the field value is set to “N/A”, as that urgency is not applicable.

/* Very urgent */
=IF(AND(Urgency="Very Urgent",Impact="Critical"),"1",
IF(AND(Urgency="Very Urgent",Impact="High"),"1",
IF(AND(Urgency="Very Urgent",Impact="Medium"),"3",
IF(AND(Urgency="Very Urgent",Impact="Low"),"3",
IF(AND(Urgency="Very Urgent",Impact="Very Low"),"4","N/A" )))))

/* Urgent */
=IF(AND(Urgency="Urgent",Impact="Critical"),"1",
IF(AND(Urgency="Urgent",Impact="High"),"2",
IF(AND(Urgency="Urgent",Impact="Medium"),"3",
IF(AND(Urgency="Urgent",Impact="Low"),"3",
IF(AND(Urgency="Urgent",Impact="Very Low"),"4","N/A" )))))

/* Not urgent */
=IF(AND(Urgency="Not Urgent",Impact="Critical"),"2",
IF(AND(Urgency="Not Urgent",Impact="High"),"3",
IF(AND(Urgency="Not Urgent",Impact="Medium"),"3",
IF(AND(Urgency="Not Urgent",Impact="Low"),"4",
IF(AND(Urgency="Not Urgent",Impact="Very Low"),"4","N/A" )))))

To tie it all together, the Priority – calculated column looks at the values of all three columns and displays whichever one does not have the value “N/A”. If none of them have that, then the column displays the text “error”.

/* Final calculation */
=IF([Priority - very urgent]<>"N/A", [Priority - very urgent],
IF([Priority - urgent]<>"N/A", [Priority - urgent],
IF([Priority - not urgent]<>"N/A", [Priority - not urgent],
"Error calculating priority")))

To test, I showed all 6 applicable columns in a view:

view_result

You can see that because the urgency was very urgent and the impact was critical, a 1 was filled into the priority – very urgent column. When the Priority – calculated column did its work, it copied over the 1 from the priority – very urgent column.

Calculated column for priority on a SharePoint list

I’m currently working on a project where we needed to assign a priority to issues based on impact and urgency. You could always let users figure this out for themselves, but it’s much better to automate it when there are clear definitions for each value and a table which translates the impact and urgency to priority.

Continue reading